
User instructions for PxWeb statistical databases
The PxWeb statistical databases contain statistical tables from which you can select the figures you need, save them, make simple calculations or form statistical graphs from them. The databases can also be used through interfaces.
The correct table must first be found in the databases, after which the necessary data must be selected from it. The following search example shows how data can be retrieved. The example uses the StatFin database but the instructions in the example are also suitable for other PxWeb statistical databases.
Search example
In the search example an answer is sought to the question “How many 18-year-olds are there in Oulu, Tampere and Turku?”
Open the StatFin database.
Searching for the right table
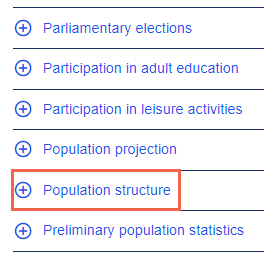
Click Population structure on the list of statistics that opens up.
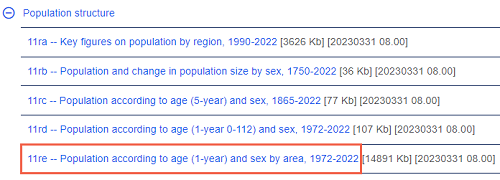
Please look at the list of tables and select a suitable table for your needs by clicking its name. In this example, the table Population according to age (1-year) and sex by area is used.
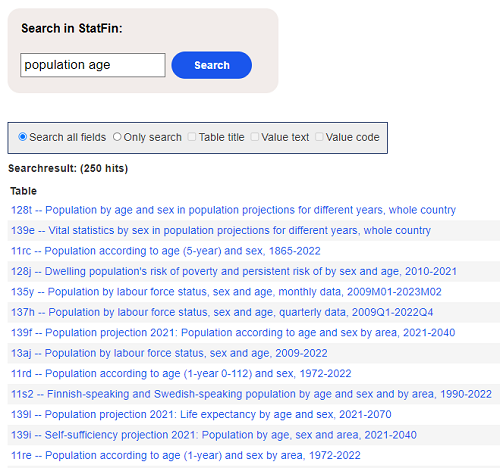
If you search for data with the database search function, note that the search word should be selected differently than in Google searches, for example. Data on 18-year-olds cannot be found with the search “18-year-olds” but the search “population age” contains useful tables from which you can select 18-year-olds in the next step.
Selection of required data
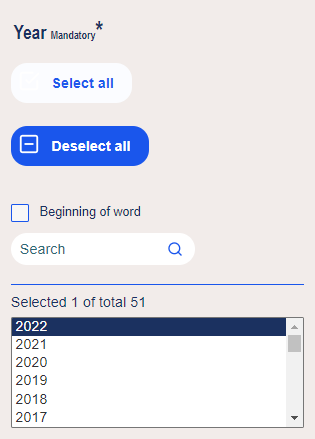
The data selection page of the table contains boxes from which you can select the data you want. At least one value must be selected from the boxes marked as Mandatory.
You can select one value by clicking it. You can select all values with the Select all button. The selected row turns blue.
There are different ways of selecting several variables:
If you want to select consecutive values from the list:
- paint them with the mouse or
- press shift and click the first and last values of the list you want.
If you want to select values here and there from the list:
- to select data, hold down the control key while selecting or
- enter the values in the search field of the selection box one at a time. When you press enter, the value is selected.
In this example, the following values are selected from the boxes:
- data: Population 31 Dec
- area: Oulu, Tampere, Turku
- age: 18
- year: 2019.
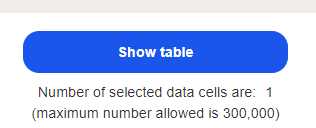
When you have selected the data you want, press the Show table button below the selection boxes.
Arrangement of the table
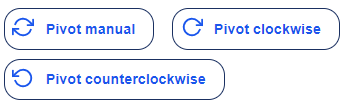
Sometimes the values are in a difficult order in the table. The order can be changed with the pivot buttons: pivot manual, pivot clockwise, pivot counterclockwise. The same functions can be found under Edit and calculate in the side menu.
Saving the table
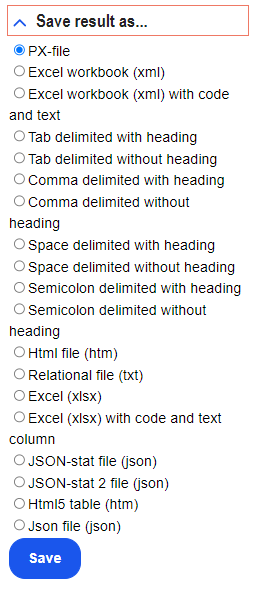
You can save the table you have made into a file in several different formats. The saving alternatives can be found under Save result as in the menu.
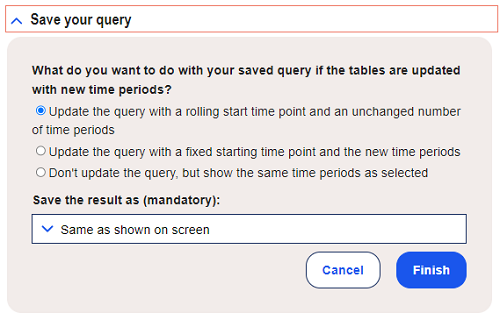
 To return to the table on the web page, you can save the selections you made in the database. You can get a link to your own table under Save your query in the menu. Please note that a link copied from the address bar of your browser does not save your selections.
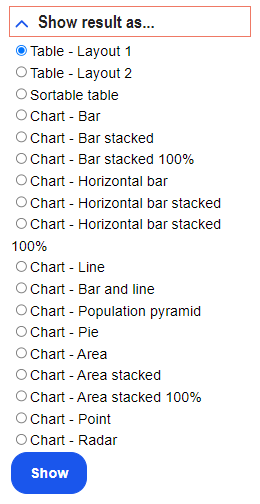
Charts and calculations
The data in the table can be viewed as different statistical charts. The chart alternatives can be found under Show result as in the menu.
Simple calculations can be made with the figures in the database (addition, subtraction, percentage calculation). The functions can be found under Edit and calculate in the menu.


Background information on the statistics
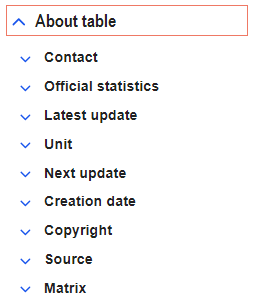
Under About table you can see, for example, the updating date of the table and find a link to the home page of the statistics where the background and concepts of the statistics are described in more detail.
Information
If you need help in using the database, please contact Statistics Finland's information service.
- info@stat.fi
- tel. +358 29 551 2220