

2. Employment turned to decline
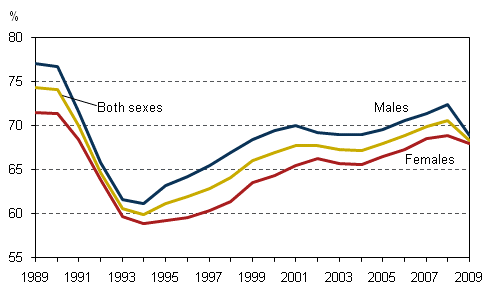
The employment rate which had been rising for the four previous years started to fall in 2009. The rate fell by 2.3 percentage points from the previous year and stood at 68.3 per cent in 2009. The employment rate fell to the level where it was in 2005.
Because employment declined faster among men than among women, men’s and women’s employment rates came closer to each other. In 2009, men’s employment rate stood at 68.8 per cent, having fallen by 3.5 percentage points from the previous year. Women’s employment rate, respectively, fell by only one percentage point to 67.9 per cent. Women’s and men’s employment rates differ by less than one percentage point, which is quite exceptional by international comparison. (Figure 1.)
Figure 1. Employment rate by sex in 1989–2009, persons aged 15 to 64, %
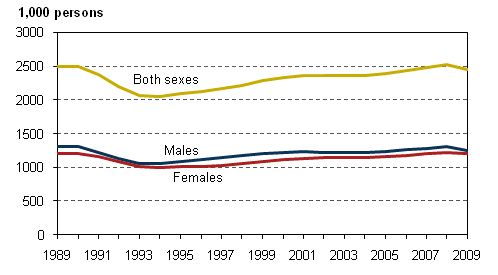
Employed persons numbered 2,457,000 in 2009. The number decreased by 74,000 persons. Whereas in 2008 the number of the employed still grew by 39,000, a clear turn for the worse happened in this respect in 2009. The number of employed persons fell to the level where it was in 2006 (figure 2). Compared with the quarters of the previous year, employment decreased in every quarter, especially in the third and fourth quarters towards the end of the year.
Figure 2. Number of employed persons by sex in 1989–2009, persons aged 15 to 74
In 2009, there were 84,000 fewer employees than one year earlier, whereas the number of self-employed persons went up by 10,000. There were 334,000 self-employed persons and unpaid family workers in 2009. The share of unpaid family workers of this total was 13,000. In 2009, self-employed persons accounted for 13.6 per cent of all employed persons. The number of self-employed persons grew especially in the 25 to 35 and 55 to 64 age groups.
2.1 Downturn affects men’s employment
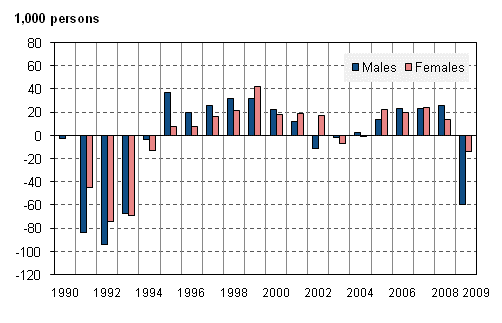
The economic downturn that began at the turn of 2008/2009 follows the same development pattern in employment as in the recession of the early 1990s so that it first affects most strongly men’s employment. Figure 3 shows a time series over 20 years on changes in the number of employed persons by gender. A clear, steep drop in the number of employed men (–60,000) can be seen in the figure in 2009 whereas in 2008 the number of employed men still grew by 26,000. The number of employed women decreased by 14,000, or by as much as the number of employed persons had grown in the previous year.
However, the drop in the number of employed persons (–74,000) in 2009 is still a fair distance away from the change in employment in 1991–1993. Over that period the annual fall in the number of employed persons exceeded one hundred thousand. An examination of the time series in Figure 3 also clearly shows how recovery from the recession started as quite a fast increase in men’s employment, while the number of employed women grew at a more moderate pace. The downward economic trend in 2002 to 2004 can also be seen in falling numbers of employed persons in those years.
Figure 3. Change from the previous year in the number of employed persons by sex in 1990–2009, persons aged 15 to 74
2.2 Employment decreases most in the industry of manufacturing
An explanation to why employment decreased most among men is the worsened employment situation in the male-dominated industries of manufacturing and construction. Figure 4 shows changes in the number of employed persons by industry during the past two years. Employment has decreased most in manufacturing where 38,000 jobs were lost between 2008 and 2009. The vast majority (31,000) of them were men’s jobs. The number of persons employed has also fallen clearly in wholesale trade and in construction. In the industry of manufacturing employment started to fall already in 2008 whereas in wholesale trade and construction the number of persons employed still grew in 2008.
Despite the economic downturn the number of persons employed actually went up in some industries. The largest growth (6,000) was seen in social work and health care. The number of persons employed has also fallen in the public sector, but in relative terms by less than in the private sector. Examined by socio-economic status employment has decreased most among manual workers and especially among men in this group. The largest individual group in which employment fell is male manual workers in manufacturing (–27,000 persons).
Figure 4. Change from the previous year in the number of employed persons by industry in 2008–2009, persons aged 15 to 74
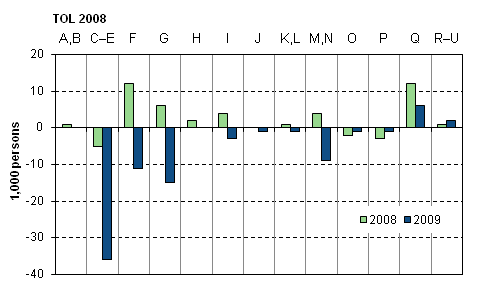
Industrial Classification (TOL 2008)
| A, B | 01–09 | Agriculture, forestry and fishing; mining and quarrying |
| C-E | 10–39 | Manufacturing; electricity, gas, steam and air conditioning and watersupply; sewerage and waste management |
| F | 41–43 | Construction |
| G | 45–47 | Wholesale and retail trade; repair of motor vehicles and motorcycles |
| H | 49–53 | Transportation and storage |
| I | 55–56 | Accommodation and food service activities |
| J | 58–63 | Information and communication |
| K, L | 64–68 | Financial, insurance and real estate activities |
| M, N | 69–82 | Professional, scientific and technical activities; administrativeand support service activities |
| O | 84 | Public administration and defence; compulsory social security |
| P | 85 | Education |
| Q | 86–88 | Human health and social work activities |
| R–U | 90–99 | Arts, entertainment and recreation; other service activities |
2.3 Number of hours actually worked decreased
Besides as fallen employment figures the economic downturn could also be seen as a decrease in the number of hours actually worked in 2009. From 2003 right up to 2008 the number of hours kept going up. The number of hours actually worked by employed persons was approximately 6 per cent lower in 2009 than in 2008. At the same time, the number of employed persons fell by 2.9 per cent, so the amount of labour input per employed person has decreased. In 2008, the average annual number of hours actually worked by an employed person was 1,664, but in 2009 the respective figure was 1,611 hours per year.
Among the reasons for the decrease in the number of hours worked were growth in the numbers of temporary lay-offs and part-time jobs, and reduced amount of overtime work. In 2009, the average number of temporarily laid-off persons was 37,000. The number fluctuated considerably over the year. The number of temporarily laid-off persons increased most in the second quarter.
There were more underemployed persons, that is, persons who would like to do more work than is on offer, in 2009 than in the previous year. While in 2008 their number was 106,000, last year it rose to 133,000.
2.4 Young people adapt on the labour market
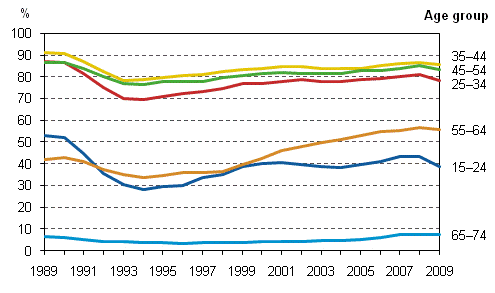
The employment rate fell in all age groups in 2009 but by most in the youngest age group of 15 to 24-year-olds. Young people’s employment rate fell by 4.8 percentage points and the number of employed young persons decreased by 32,000. Employment has, indeed, decreased most among young people.
Shortage of work affected young men more than young women. Over the 2008–2009 period, employment rate fell by 5.9 percentage points among young men and by 3.6 percentage points among young women. Indeed, young women’s employment rate remained higher than young men’s, or at 41.4 per cent, while the respective figure for young men was 35.6 per cent.
By contrast, employment rate has hardly fallen at all among those aged 55 and over. In the 55 to 64 age group employment rate fell by only one percentage point and stood at 55.5 per cent in 2009. Among women in this age group the employment rate even rose slightly. In the oldest age group of 64 to 74-year-olds the employment rate, which has been going up for quite some time now, also remained nearly unchanged in 2009. While at its lowest in 1996 the employment rate for this age group stood at 3.2 per cent, in 2009 it was already as high as 7.1 per cent. However, the proportion of persons employed is quite low in this age group. (Figure 5.)
Figure 5. Employment rates by age group in 1989–2009, %
2.5 The falling trend of unemployment rate turned upwards
The unemployment rate has been falling throughout the time period since the recession of the early 1990s. The year 2009 was the first one when the unemployment rate started to rise again since the peak unemployment year of 1994 of the previous recession. Last year, the unemployment rate was 8.2 per cent. Thus, unemployment rate rose to the level where it was in 2005. Men’s unemployment rate was 8.9 per cent and women’s 7.6 per cent.
In 2009, the average number of unemployed persons was 221,000, which was 49,000 higher than in 2008. There were 122,000 unemployed men and 99,000 unemployed women. Compared to 2008, there were 37,000 more unemployed men and 12,000 more unemployed women. Compared with the quarters of the previous year, the number of unemployed persons increased especially in the second quarter of 2009.
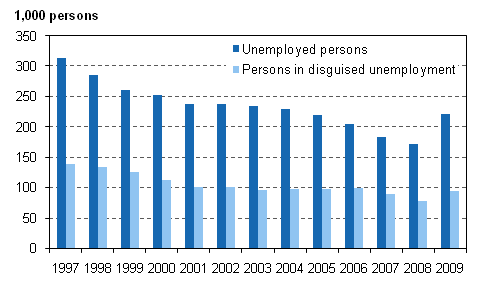
Besides unemployed persons, persons in disguised unemployment can also be regarded as jobless. Persons in disguised unemployment are persons outside the labour force who would like to be gainfully employed but do not actively look for work for diverse reasons. In 2009, there were 94,000 persons in disguised unemployment. The numbers of persons in disguised unemployment were the highest in the 15 to 24 and 55 to 64 age groups (30,000 and 22,000, respectively). The combined total number of unemployed persons and persons in disguised unemployment was 315,000 in 2009, which equals the level of 2005. (Figure 6.)
Figure 6. Unemployed persons and persons in disguised unemployment in 1997–2009, persons aged 15 to 74
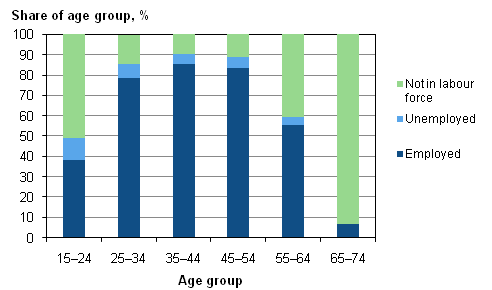
Between 2008 and 2009, the unemployment rate has risen in all age groups (figure 7). However, measured with the unemployment rate, unemployment among persons in the 15 to 24 age group is in a class of its own. In 2009, the unemployment rate, that is, the share of unemployed persons of the labour force, was 21.5 per cent among young persons. The number of unemployed young persons was also the highest, at 69,000, when compared with other ten-year age cohorts. When the shares of unemployed persons of total age groups are examined, we can see that one in ten of young persons between the ages of 15 and 24 were unemployed (figure 8).
Figure 7. Unemployment rates by age group in 1989–2009, %
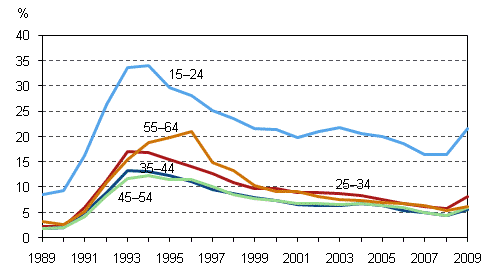
Figure 8. Shares of employed and unemployed persons and persons not in labour force of age cohort in 2009, %
However, examinations of unemployment should also take into account the development of unemployment in other age groups. Between 2008 and 2009, unemployment grew by most in relative terms in the 25 to 34 age group where it went up by 42.4 percentage points. A large group of unemployed persons is formed by people between the ages of 25 and 54, of whom 123,000 persons were unemployed in 2009. This group forms 55.7 per cent of all unemployed persons.
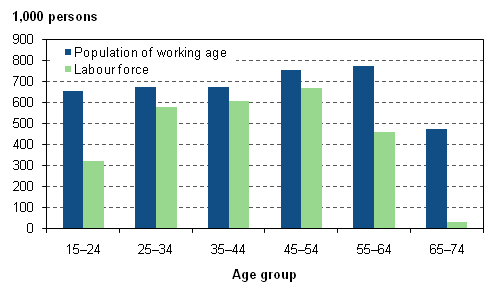
2.6 Population of working age increased, labour force decreased
From 2008 to 2009, the size of the population of working age grew by 21,000 persons in Finland. In 2009, the size of the Finnish population of working age, i.e. between the ages of 15 and 74, was 4,025,000 persons. The number of persons aged between 55 and 64 showed the largest growth of 15,000. Indeed, persons aged from 55 to 64 represent the largest age group in the population of working age (figure 9).
Although the number of persons of working age increased, the labour force decreased by 25,000 persons, or by around one per cent from 2008. There were 1,347,000 persons outside the labour force. The number grew by 46,000 persons, the majority (34,000) of them men. In the population outside the labour force the age groups of 15 to 24 and 55 to 64 showed the largest growth. The commonest reasons why people in these age groups exit the labour force are commencement of studies or old-age retirement. The number of persons outside the labour force has increased among persons aged 60 to 64 (20,000) but decreased in the 55–59 age group (–9,000). In the 60–64 age group, labour force participation rate fell by 1.6 percentage points to 41.2 per cent. Among persons aged 55 to 59, labour force participation rate rose, respectively, by 1.8 percentage points to 76.8 per cent.
Figure 9. Population of working age and labour force by age group in 2009
Source: Labour force survey 2009. Statistics Finland
Inquiries: Heidi Melasniemi-Uutela (09) 1734 2523, Olga Kambur (09) 1734 3565, tyovoimatutkimus@stat.fi
Director in charge: Riitta Harala
Updated 3.12.2010
Official Statistics of Finland (OSF):
Labour force survey [e-publication].
ISSN=1798-7857. 17 2009,
2. Employment turned to decline
. Helsinki: Statistics Finland [referred: 18.7.2024].
Access method: http://www.stat.fi/til/tyti/2009/17/tyti_2009_17_2010-12-03_kat_002_en.html