

Published: 2 February 2018
Steady support for Sauli Niinist� in different areas in the Presidential election 2018
In the first election round of the Presidential election, Sauli Niinist� received the majority of the votes cast and was elected the President of the Republic. Niinist�, a candidate of a constituency association, received 1,875,342 votes in the election, that is, 62.6 per cent of all votes cast. Niinist� gathered votes evenly in different areas. Pekka Haavisto, the candidate of the Green League received the second most votes (371,254). Haavisto’s share of votes cast was 12.4 per cent. The difference between the two candidates with most votes cast was thus 1,504,088 votes and 50.2 percentage points. The data are based on Statistics Finland's statistics on Presidential election 2018.
Support for the presidential candidates in the Presidential election 2018, first election, and support for the corresponding party in the Presidential election 2012, %
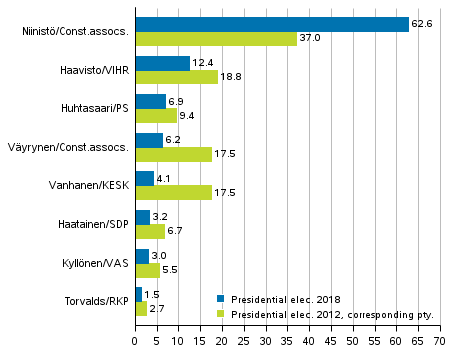
Sauli Niinist�/constituency association B (corresponding party KOK), Paavo V�yrynen/constituency association A (corresponding party KESK)
Niinist�’s share of votes cast was 25.6 percentage points higher than in the first round of the Presidential election in 2012. In turn, Haavisto's share of votes cast was 6.4 percentage points lower than his support in the 2012 Presidential election.
The candidate of the Finns Party, Laura Huhtasaari, received the third most votes (207,337 votes), she gained 6.9 per cent of all votes cast.
Paavo V�yrynen, a candidate of a constituency association, received 185,305 votes and got 6.2 per cent of all votes cast. V�yrynen's share of votes was 11.3 percentage points lower than his share of votes cast in the 2012 Presidential election. Then he was the candidate of the Centre Party of Finland. The candidate of the Centre Party in the 2018 election, Matti Vanhanen, received 122,383 votes and 4.1 per cent of all votes cast, which was 13.4 percentage points lower than the number of votes cast for the party’s candidate in the 2012 Presidential election.
Tuula Haatainen, the candidate of the Social Democratic Party, received the sixth most votes in the election, 97,294 votes and 3.2 per cent of all votes cast. The support for Haatainen was 3.5 percentage points lower than the support for the SDP's candidate in the 2012 Presidential elections. Merja Kyll�nen, the candidate of the Left Alliance, had a share of 3.0 per cent of all votes cast, and she received 89,977 votes. The candidate of the Swedish People's Party, Nils Torvalds, got 44,776 votes, which was 1.5 per cent of votes cast.
Voting turnout fell from the previous Presidential election
The voting percentage of Finnish citizens living in Finland was 69.9 per cent, which was 2.9 percentage points lower than in the first round of the Presidential election in 2012. The voting percentage rate of women was 72.9 per cent and that of men 66.8 per cent. In Mainland Finland the voting percentage was lowest in Rautavaara (57.4 per cent) and highest in Luoto (84.5 per cent).
Persons entitled to vote, persons who voted and advance voters (Finnish citizens resident in Finland) in Presidential elections 1994, 2000, 2006, 2012 and 2018, first election
| 1994 | 2000 | 2006 | 2012 | 2018 | |
| Persons entitled to vote |
3,874,328 | 3,962,283 | 4,063 392 | 4,172,200 | 4,246,803 |
| Men | 1,853,447 | 1,906,441 | 1,964,073 | 2,021,365 | 2,064,032 |
| Women | 2,020 881 | 2,055,842 | 2,099,319 | 2,150,835 | 2,182,771 |
| Persons who voted |
3,183,027 | 3,046,448 | 3,001,786 | 3,038,645 | 2,969,401 |
| Men | 1,493,908 | 1,394,915 | 1,375,575 | 1,415,471 | 1,378,029 |
| Women | 1,689,119 | 1,651,533 | 1,626,211 | 1,623,174 | 1,591,372 |
| Turnout % | 82.2 | 76.9 | 73.9 | 72.8 | 69.9 |
| Men | 80.6 | 73.2 | 70.0 | 70.0 | 66.8 |
| Women | 83.6 | 80.3 | 77.5 | 75.5 | 72.9 |
| Advance voters |
1,338,376 | 1,345,174 | 1,274,595 | 1,389,904 | 1,559,488 |
| Men | 594,201 | 575,463 | 541,503 | 610,379 | 686,060 |
| Women | 744,175 | 769,711 | 733,092 | 779,525 | 873,428 |
| Advance voters, turnout % (of persons who voted) |
42.0 | 44.2 | 42.5 | 45.7 | 52.5 |
| Men | 39.8 | 41.3 | 39.4 | 43.1 | 49.8 |
| Women | 44.1 | 46.6 | 45.1 | 48.0 | 54.9 |
Voting was more active than on the level of the whole country in the constituencies of Helsinki (72.1 per cent), Pirkanmaa (71.4 per cent), Uusimaa (71.4 per cent), Varsinais-Suomi (71.3 per cent), Vaasa (71.2 per cent), and Satakunta (70.6 per cent). Among the constituencies, the voting percentage was lowest in the constituency of �land (58.7 per cent), of the constituencies in Mainland Finland, the voting percentage was lowest in the constituency of Savo-Karjala (66.3 per cent).
The voting percentage of Finnish citizens living abroad was 13.3 per cent, which was 0.5 percentage points lower than in the Presidential election 2012.
The total number of persons entitled to vote in the Presidential election 2018 was 4,498,004. The number of persons entitled to vote resident in Finland was 4,246,803 and the number of persons entitled to vote resident abroad was 251,201.
Candidate analysis
The candidate analysis examines candidates’ results in the first election round of the Presidential election 2018 with the help of various background variables in classified areas. The background variables used in the analysis are the area’s degree of urbanisation, number of children and pensioners, unemployment rate and income level. For example, in areas with high unemployment, the unemployment rate is higher than the country’s average rate and vice versa. The background variables used are not mutually exclusive, for example, the area's degree of urbanisation also partially describes the area’s income level.
The areas used in the analysis are formed based on voting districts, the analysis is based on 1,989 voting districts. The voting districts are grouped by each background variable into three categories. The classification of voting districts is based on the data derived from the voting register on persons entitled to vote and Statistics Finland’s statistical data.
The analysis figures illustrate the relative difference of candidate's support in the area compared with their support in the whole country. In practice, the reported figures indicate how many percentages the candidates’ support in the area was higher or lower relative to his or her support received in the whole country. This presentation was selected because the strong concentration of votes cast on one candidate makes it difficult to interpret the difference between mere support percentages or regional support percentages calculated in percentage units. The selected examination approach makes it possible to examine differences in the candidates’ regional support regardless of the level of support attained in the election.
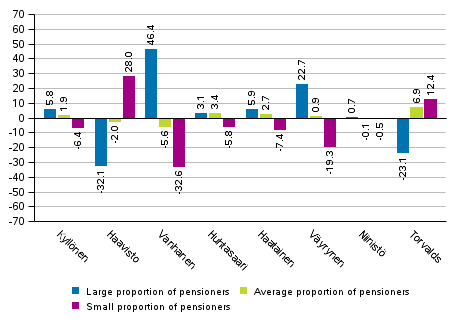
The support for Niinist�, who received most votes in the election, was very steady in areas limited by the number of pensioners, so the share of pensioners does not appear to have an effect on his support. The support for Laura Huhtasaari does not vary significantly in areas limited in this way either. The support for Pekka Haavisto and Nils Torvalds was greater than in the whole country in areas where the number of pensioners was lower than average. The support for Matti Vanhanen and Paavo V�yrynen seems to be similar to each other examined by the share of pensioners, both candidates received more votes in relative terms in areas where the share of pensioners is high. The support for Merja Kyll�nen and Tuula Haatainen was also focused somewhat on areas where the share of pensioners was high or average for the country, though clearly less than for Vanhanen and V�yrynen.
Difference between the support for the candidates in the whole country and in areas specified by the number of pensioners in the Presidential election 2018, %
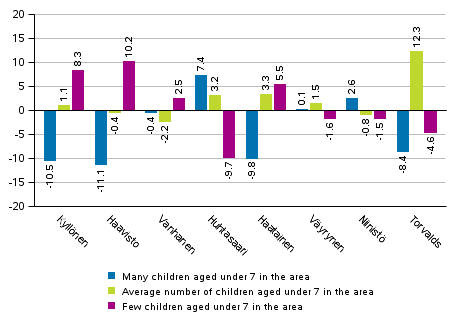
Areas limited by the number of children aged under seven divide the support received by the candidates into roughly two groups. The support for Kyll�nen, Haavisto and Haatainen was greater than average in areas where the number of children aged under seven was low. In turn, Huhtasaari received somewhat greater support than average in areas where the number of children aged under seven was higher than average for the country. For Niinist�, Vanhanen and V�yrynen, the differences to the share of votes in the whole country were not big.
Difference between the support for the candidates in the whole country and in areas specified by the number of children aged under seven in the Presidential election 2018, %
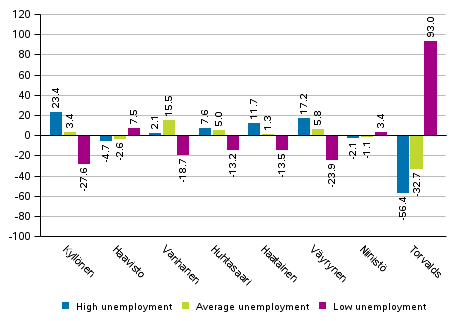
The support for Kyll�nen and V�yrynen was focused on areas where unemployment was higher than average for the country. The support for Huhtasaari and Haatainen was also emphasised on areas with high and medium high levels of unemployment, but not as clearly. Vanhanen gathered higher support than in the whole country in areas with average levels of unemployment, but his support was clearly lower in areas with low levels of unemployment. In turn, Torvalds’ support was strongly focused on areas with low unemployment. In contrast, the area’s level of unemployment did not have much significance for Niinist�’s support.
Difference between the support for the candidates in the whole country and in areas specified by unemployment in the Presidential election 2018, %
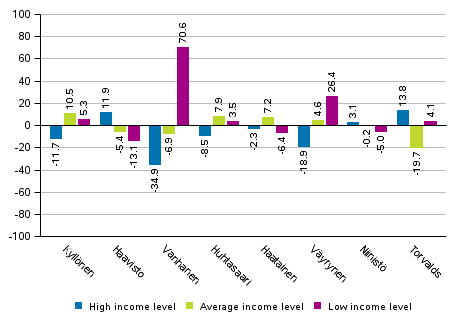
The support for Kyll�nen and Huhtasaari was similar in areas limited by income level. Both candidates’ support was slightly higher than in the whole country in areas of average income level and, to a lesser extent, in areas of low income level. The support for V�yrynen and particularly for Vanhanen was most clearly focused on areas with low income level. Haatainen’s support was slightly higher than average in the whole country in areas with average income level. Torvalds got most support in areas of high income level, while in average income level areas his support was clearly lower than the level of the whole country. The area’s income level did not have much significance for Niinist�’s support, the support figures received in areas did not differ much from the level of the whole country.
Difference between the support for the candidates in the whole country and in areas specified by income level in the Presidential election 2018, %
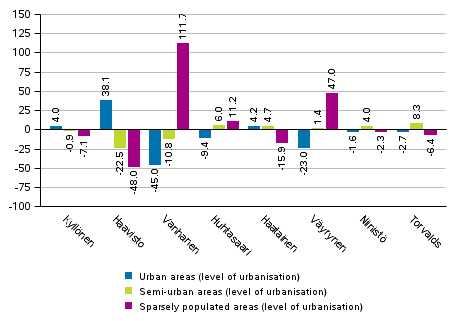
The area’s degree of urbanisation particularly had an effect on the support for Haavisto, Vanhanen and V�yrynen. The support for Haavisto was clearly higher than in the whole country in urban areas, while in population centres and sparsely-populated areas, the support for Haavisto was clearly below the level for the whole country. Viewed by this background variable, the support profile of Vanhanen and V�yrynen was, in turn, nearly the opposite to that of Haavisto. Their support was distinctly focused on sparsely-populated areas, which was strongly emphasised for Vanhanen. For the other candidates, the degree of urbanisation had not much importance for their support. The support for Haatainen was slightly lower than the level of the whole country in sparsely-populated areas, while the support for Huhtasaari was slightly focused on areas outside urban areas.
Difference between the support for the candidates in the whole country and in areas specified by degree of urbanisation in the Presidential election 2018, %
Source: Presidential Elections 2018, 1st round, Statistics Finland
Inquiries: Sami Fredriksson 029 551 2696, Jaana Asikainen 029 551 3506, vaalit@stat.fi
Director in charge: Jari Tarkoma
Publication in pdf-format (383.8 kB)
- Tables
-
Tables in databases
Pick the data you need into tables, view the data as graphs, or download the data for your use.
Appendix tables
- Quality descriptions
-
- Presidential elections, quality description (2.2.2018)
Updated 2.2.2018
Official Statistics of Finland (OSF):
Presidential elections [e-publication].
ISSN=2242-3699. 2018. Helsinki: Statistics Finland [referred: 17.8.2024].
Access method: http://www.stat.fi/til/pvaa/2018/pvaa_2018_2018-02-02_tie_001_en.html