

Published: 26 May 2020
Transport in domestic waterborne traffic increased in 2019
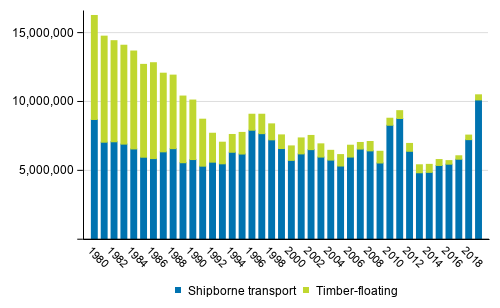
The total volume of goods transported in domestic waterborne traffic was 10,520,212 tonnes in 2019. This covers both shipborne goods transport and timber floating. Transport increased by 39 per cent compared to 2018. The most transported goods were oil products, raw minerals and cement as well as metals and metal products. In absolute numbers, transport of metals and metal products and raw minerals and cement grew most. Ninety-six per cent of the goods were transported on board ships and the remainder consisted of timber floating. In addition to goods, 4.75 million passengers were transported in domestic waterborne traffic in 2019, of which 0.23 million in inland waterways and 4.5 million in coastal areas.
Volume of shipborne goods transport and floated goods in domestic waterborne traffic in 1980 to 2019
Shipborne goods transport
In 2019, the total volume of shipborne goods transport was 10,148,201 tonnes. Ninety-five per cent of this was transported in coastal areas. The transport is coastal transport if the port of departure or destination is situated on the coast. As in previous years, oil products were transported most, 3.5 million tonnes. The next most transported goods were raw minerals and cement as well as metals and metal products. The transport volume of both these types of goods increased by over one million tonnes compared to 2018. Transport of hard coal and coke decreased most.
Table 1. Volume of shipborne goods transport in domestic waterborne traffic by type of goods in 2017 to 2019
| Commodity group | Year | ||
| 2017 | 2018 | 2019 | |
| Total | 5,843,684 | 7,265,619 | 10,148,201 |
| Timber | 608,697 | 698,109 | 724,393 |
| Sawn wood | 9,043 | 4,071 | 4,259 |
| Wood pulp | 4,661 | 919 | 2,491 |
| Paper | 24,404 | 17,790 | 17,964 |
| Plywood and veneers | 1,047 | 1,733 | 3,645 |
| Ores and concentrates | 131,304 | 132,720 | 103,162 |
| Metals and metal manufactures | 392,645 | 694,226 | 2,346,376 |
| Oil products | 3,554,819 | 3,488,766 | 3,487,898 |
| Coal and coke | 155,155 | 368,460 | 209,126 |
| Fertilizers | 135,301 | 162,148 | 152,097 |
| Chemicals | 80,694 | 66,316 | 138,537 |
| Crude minerals and cement | 570,264 | 1,469,484 | 2,799,477 |
| Cereals | 7,162 | 1,980 | 7,136 |
| General cargo | 163,645 | 156,197 | 149,835 |
| Other merchandise | 4,843 | 2,700 | 1,805 |
The transport performance of domestic waterborne traffic was 3.1 billion tonne-kilometres and it grew by 0.2 billion tonne-kilometres from the year before. Ninety-seven per cent of the transport performance came from shipborne traffic and 96 per cent from coastal traffic.
Timber floating and shipborne transport
In domestic waterborne traffic, timber was transported both by floating and vessels. A total of 1.1 million tonnes of timber was transported. A total of 0.37 million tonnes were floated and 0.72 million tonnes were transported by ship. The transport of timber grew by six per cent compared with 2018. In 2019, timber was floated only in the Vuoksi river basin.
Table 2. Transport of timber in 2017 to 2019
| Transport type | Year | ||
| 2017 | 2018 | 2019 | |
| Timber-floating | 250,000 | 330,000 | 372,011 |
| Shipborne transport | 608,697 | 698,109 | 724,393 |
| Transported volumes of timber | 858,697 | 1,028,109 | 1,096,404 |
Goods transport between �land and Mainland Finland
A total of 351,024 tonnes of goods were transported between Mainland Finland and �land. A total of 132,413 tonnes of goods were imported to �land and 218,611 tonnes of goods were exported from there. In total, goods transport between Mainland Finland and �land grew by 124,913 tonnes compared with the previous year, most of which was caused by increased exports of timber. Most imports to �land consisted of bulk goods, 87,000 tonnes, oil products, 32,000 tonnes, and raw minerals and cement, 12,000 tonnes. Most exports from �land consisted of timber, 157,000 tonnes, and bulk goods, 52 500 tonnes.
Table 3. Goods transport between �land and Mainland Finland in 2017 to 2019
| Direction and commodity group | Year | |||
| 2017 | 2018 | 2019 | ||
| Import | Timber | - | - | - |
| Oil products | 31,671 | 35,656 | 31,538 | |
| General cargo | 95,779 | 84,603 | 87,391 | |
| Other merchandise | 38,896 | 23,893 | 13,484 | |
| Import total | 166,346 | 144,152 | 132,413 | |
| Export | Timber | 6,619 | 12,878 | 157,175 |
| Oil products | 152 | 151 | 177 | |
| General cargo | 48,037 | 62,197 | 52,468 | |
| Other merchandise | 17,768 | 6,733 | 8,791 | |
| Export total | 72,576 | 81,959 | 218,611 | |
Volume of transport through the Saimaa Canal
A total of 73,037 tonnes of goods were registered in domestic traffic through the Saimaa Canal in 2019. Raw minerals and cement, 49,962 tonnes, and hard coal and coke, 20,826 tonnes, were transported most. Compared with 2018, transport fell by less than one per cent. Raw minerals and cement, 54,571 tonnes, and hard coal and coke, 18,774 tonnes, were transported most also in 2018.
Passenger transport
Altogether 4.75 million passengers were transported in domestic waterborne traffic in 2019. Of the passengers, 4.5 million travelled on the coast and 0.23 million in inland waterways. The traffic recorded in the statistics includes both cruises and liner and ferry traffic. The number of passengers was highest in the area of the Gulf of Finland, 3.2 million, and the passenger traffic performance was highest in traffic between Mainland Finland and �land, 93 million passenger-kilometres. Compared with 2018, the total number of passengers increased by three per cent.
Table 4. Passengers in domestic waterborne traffic in 2017 to 2019
| Water basin | Year | ||
| 2017 | 2018 | 2019 | |
| Coasting and in inland waterways in total | 4,546,869 | 4,616,156 | 4,754,780 |
| Coasting in total | 4,304,233 | 4,382,248 | 4,523,960 |
| Gulf of Finland | 2,875,142 | 3,044,188 | 3,197,655 |
| Archipelago Sea | 253,469 | 261,406 | 231,820 |
| Traffic between the mainland and �land | 670,787 | 663,392 | 667,995 |
| �land | 391,634 | 395,325 | 395,983 |
| Sea of Bothnia | 3,601 | 3,953 | .. |
| Bay of Bothnia | 20,650 | 20,645 | 26,407 |
| Inland waterways in total | 242,636 | 233,908 | 230,820 |
| Vuoksi watercourse | 116,161 | 103,127 | 110,965 |
| Kymi River watercourse | 29,670 | 32,413 | 29,372 |
| Kokem�ki River watercourse | 71,462 | 70,303 | .. |
| Ostrobothnias area | 2,148 | 2,305 | .. |
| Oulu river and northern Finland | 23,195 | 25,760 | 15,369 |
1) .. = Data is subject to secrecy
Source: Transport and Tourism, Statistics Finland
Inquiries: Matti Kokkonen 029 551 3770, Sami Lahtinen 029 551 3207, matti.kokkonen@stat.fi
Director in charge: Mari Yl�-Jarkko
Publication in pdf-format (191.9 kB)
- Tables
-
Tables in databases
Pick the data you need into tables, view the data as graphs, or download the data for your use.
Updated 26.05.2020
Official Statistics of Finland (OSF):
Domestic Waterborne Traffic [e-publication].
ISSN=2670-1979. 2019. Helsinki: Statistics Finland [referred: 18.7.2024].
Access method: http://www.stat.fi/til/kvliik/2019/kvliik_2019_2020-05-26_tie_001_en.html