

Published: 18 November 2021
Persons having become laid off or unemployed in the corona year 2020 by occupation
Reviews were added to the release on 24 November 2021.
The review 1 and 2 were corrected on 26 October 2022. The correcitons are indicated in red.
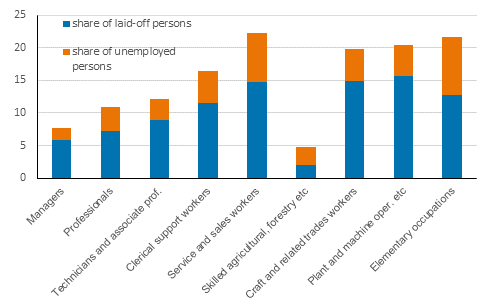
According to Statistics Finland’s employment statistics, 11 per cent of persons employed in 2019 were temporarily laid off at least once and the number of lay-off periods was 346,000 during 2020. In the first year of the pandemic, the effects on employed persons varied widely between occupational groups. In relative terms, the lay-offs concerned most plant and machine operators, and assemblers (15.7% of occupational group workers, 31,000), craft and related trades workers (14.8%, 35,000) and service and sales workers (14.7%, 71,000).
The occupational data of the employment statistics for 2019 can be combined with the data on persons having become laid off or unemployed in 2020. This allows us to see how lay-offs and unemployment treated different occupations. In 2020, the number of temporarily laid off persons increased by 225,000 (+636%) from the previous year and the number of temporary lay-off periods grew by 297,000 (+610%). There were 2.4 million employed persons in Finland in the last week of 2019.
Next, the number of temporarily laid off persons in 2020 is compared with the occupational data of employment statistics for 2019 on the least detailed level of the Classification of Occupations (Classification of Occupations 2010, 1-digit level). It can be seen how the lay-offs concerned in relative terms the largest numbers of plant and machine operators, and assemblers (15.7% of occupational group workers, 31,000), craft and related trades workers (14.8%, 35,000) and service and sales workers (14.7%, 71,000).
Share of persons having become laid off or unemployed in 2020 among persons employed in 2019 on the least detailed level of the Classification of Occupations
On the most detailed level of the Classification of Occupations (Classification of Occupations 2010, 5-digit level), the most laid-off occupational groups among persons employed in 2019 were in relative terms: aircraft pilots and related associate professionals (AML2010 3153, 75.3%), travel attendants and travel stewards (AML2010 5111, 74.5%), hotel receptionists (4224, 58.5%), aircraft engine mechanics and repairers (7232, 56.5%) and dispensing opticians (3254, 53.7%). Appendix table 1 shows the numbers of laid-off persons and persons having become unemployed in all occupations with over 100 unemployed or laid-off persons in 2019.
During 2020, the number of temporarily laid-off persons was highest among sales workers (AML2010: 5223, 18,400 persons), cooks (AML2010: 51201, 8,300 persons) and commercial sales representatives (AML 2010: 3322, 7,200) persons.
1.1 Unemployed persons by occupation
In the first year of the pandemic, 121,000 (+8%) persons became unemployed at least once and there were 151,000 (+2%) periods of unemployment among employed persons in the last week of 2019.
On the least detailed level of the Classification of Occupations, the highest number of persons employed in 2019 became unemployed in relative terms among elementary occupations (9%), service and sales workers (7.6%) and craft and related trades workers (5%).
In the occupations of employed persons in 2019 where over 500 persons were working, the occupational groups that had experienced unemployment most in relative terms on the most detailed level of the Classification of Occupations were: travel guides (AML2010: 5113, 28%), teachers’ aides (5312, 27.5%), children’s club leaders (53113, 26.6%), kindergarten assistants (91124, 23.6%) and athletes and sports players (3421, 16.4%).
1.2 Durations of lay-offs by occupation
In 2020, the most common lengths of lay-off periods were two to six months (31% of lay-offs), under two weeks (23% of lay-off periods) and one to two months (20%).
Examined by occupation, the most common temporary lay-off period was under two weeks for managers, professionals and technicians and associate professionals, craft and related trades workers, and plant and machine operators, and assemblers. The most common length of a laid-off period was two to six months for clerical support workers, service and sales workers, farmers and forest workers, and elementary occupations.
Figure 2. Lengths of lay-off periods on the 1-digit level of the Classification of Occupations 2019
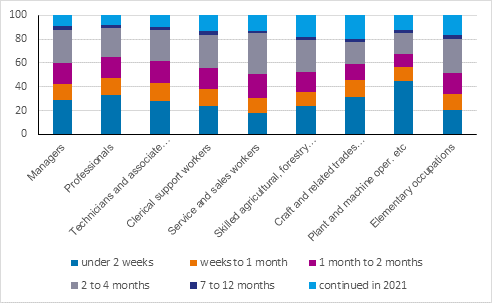
The examination concerns periods that started and ended during 2020. A closer examination is limited to 2020 because data for 2021 have not yet been published. If the unemployment continued after 2020, this is visible in the category “Continued in 2021”.
There were most temporary lay-off days per one employee in the occupational group among butchers, fishmongers, etc. (AML 7511), 113 days per employee; shoemaking and related machine operators (AML 8156), 99 days; fur and reindeer producers (AML 61291), 81 days; vehicle cleaners (AML 9122), 78 days; and rubber products machine operators (AML 8141), 77 days.
In Statistics Finland’s employment statistics for 2019, the occupations of wage and salary earners and entrepreneurs aged 18 to 74 in the last week of the year have been classified into occupational groups according to the Classification of Occupations 2010 standard. The data on unemployment in the employment statistics are based on the data of the Register of Job Seekers of the Ministry of Economic Affairs and Employment.
Source: Employment Statistics, Statistics Finland
Inquiries: Juho Keva 029 551 3601, info@stat.fi
Head of Department in charge: Hannele Orjala
Publication in pdf-format (408.0 kB)
- Reviews
- Tables
-
Tables in databases
Pick the data you need into tables, view the data as graphs, or download the data for your use.
Appendix tables
Updated 18.11.2021
Official Statistics of Finland (OSF):
Employment [e-publication].
ISSN=2323-6825. Industry, employer sector and jobs 2019. Helsinki: Statistics Finland [referred: 19.4.2024].
Access method: http://www.stat.fi/til/tyokay/2019/04/tyokay_2019_04_2021-11-18_tie_001_en.html