

Published: 10 June 2021
Transport in domestic waterborne traffic decreased in 2020
The total volume of goods transported in domestic waterborne traffic was 7.5 million tonnes in 2020. This covers both shipborne goods transport and timber floating. Transport declined by 29 per cent compared to 2019. The most transported goods were oil products, raw minerals and cement as well as timber. In absolute numbers, the biggest growth was recorded in the transport of general cargo and fertilisers. Ninety-five per cent of the goods were transported on board ships and the remainder consisted of timber floating. In addition to goods, 2.9 million passengers were transported in domestic waterborne traffic in 2020, of which 0.2 million in inland waterways and 2.7 million in coastal areas.
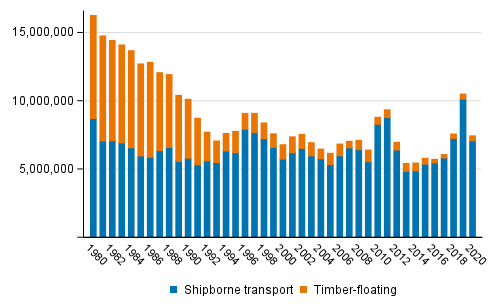
Volume of shipborne goods transport and floated goods in domestic waterborne traffic in 1980 to 2020
Shipborne goods transport
In 2020, the total volume of shipborne goods transport was 7.1 million tonnes. The total volume of goods transported returned to the level of previous years after the exceptionally lively year 2019, the fall being mainly explained by decreased transport of metals and metal products. Ninety-three per cent of the total was transported in coastal areas. The transport is coastal transport if the port of departure or destination is situated on the coast. As in previous years, oil products were transported most, 3,5 million tonnes. The second most transported were crude minerals and cement as well as timber. However, the transport volume of both these types of goods decreased compared to 2019.
Table 1. Volume of shipborne goods transport in domestic waterborne traffic by type of goods in 2018 to 2020
| Commodity group | Year | ||
| 2018 | 2019 | 2020 | |
| Total | 7,265,619 | 10,148,201 | 7,096,948 |
| Timber | 698,109 | 724,393 | 685,802 |
| Sawn wood | 4,071 | 4,259 | 7,727 |
| Wood pulp | 919 | 2,491 | 2,398 |
| Paper | 17,790 | 17,964 | 18,020 |
| Plywood and veneers | 1,733 | 3,645 | 1,520 |
| Ores and concentrates | 132,720 | 103,162 | 99,166 |
| Metals and metal manufactures | 694,226 | 2,346,376 | 10,821 |
| Oil products | 3,488,766 | 3,487,898 | 3,458,156 |
| Coal and coke | 368,460 | 209,126 | 37,836 |
| Fertilizers | 162,148 | 152,097 | 183,169 |
| Chemicals | 66,316 | 138,537 | 105,904 |
| Crude minerals and cement | 1,469,484 | 2,799,477 | 2,288,650 |
| Cereals | 1,980 | 7,136 | 8,048 |
| General cargo | 156,197 | 149,835 | 182,863 |
| Other merchandise | 2,700 | 1,805 | 6,868 |
The transport performance of domestic shipborne traffic was 2.6 billion tonne-kilometres and it decreased by 0.5 billion tonne-kilometres from the year before. Ninety-six per cent of the transport performance came from shipborne traffic and 95 per cent from coastal traffic.
Timber floating and shipborne transport
In domestic waterborne traffic, timber was transported both by floating and by ship. A total of 1.05 million tonnes of timber were transported. A total of 0.36 million tonnes were floated and 0.69 million tonnes were transported by ship. The transport of timber decreased by four per cent compared with 2019. In 2020, timber was floated only in the Vuoksi river basin.
Table 2. Transport of timber in 2018 to 2020
| Transport type | Year | ||
| 2018 | 2019 | 2020 | |
| Timber-floating | 330,000 | 372,011 | 363,221 |
| Shipborne transport | 698,109 | 724,393 | 685,802 |
| Transported volumes of timber | 1,028,109 | 1,096,404 | 1,049,023 |
Goods transport between �land and Mainland Finland
A total of 312,134 tonnes of goods were transported between Mainland Finland and �land. A total of 124,416 tonnes of goods were imported to �land and 187,718 tonnes of goods were exported from there. In total, goods transport between Mainland Finland and the �land Islands decreased by 38,890 tonnes compared with the previous year, which is explained by decreased transport of all types of goods apart from exports of general cargo. General cargo, 85,781 tonnes, and oil products, 27,951 tonnes, were imported most to the �land Islands. Most exports from �land consisted of timber, 120,858 tonnes, and general cargo, 58,249 tonnes.
Table 3. Goods transport between �land and Mainland Finland in 2018 to 2020
| Direction and commodity group | Year | |||
| 2018 | 2019 | 2020 | ||
| Import | Timber | - | - | - |
| Oil products | 35,656 | 31,538 | 27,951 | |
| General cargo | 84,603 | 87,499 | 85,781 | |
| Other merchandise | 23,893 | 18,247 | 10,684 | |
| Import total | 144,152 | 137,284 | 124,416 | |
| Export | Timber | 12,878 | 157,175 | 120,858 |
| Oil products | 151 | 177 | 24 | |
| General cargo | 62,197 | 52,576 | 58,249 | |
| Other merchandise | 6,733 | 13,554 | 8,587 | |
| Export total | 81,959 | 223,482 | 187,718 | |
Volume of transport through the Saimaa Canal
A total of 86,179 tonnes of goods were registered in domestic traffic through the Saimaa Canal in 2020. Raw minerals and cement, 66,214 tonnes, and hard coal and coke, 11,216 tonnes, were transported most. Compared with 2019, transport increased by 18 per cent. Raw minerals and cement, 49,962 tonnes, and hard coal and coke, 20,826 tonnes, were transported most in 2019 as well.
Passenger transport
Altogether 2.9 million passengers were transported in domestic waterborne traffic in 2020. Of the passengers, 2.7 million travelled in coastal areas and 0.2 million in inland waterways. The traffic recorded in the statistics includes both cruises and liner and ferry traffic. The number of passengers was highest in the area of the Gulf of Finland, 1.7 million, and also the passenger traffic performance was highest in the area of the Gulf of Finland, 87 million passenger-kilometres. As a result of the prevailing pandemic, the number of passengers fell drastically especially in coastal areas, by 41 per cent, while the drop was more moderate in inland waterways and the passenger volume fell by 19 per cent compared with 2019. The total number of passengers decreased by 40 per cent from 2019.
Table 4. Passengers in domestic waterborne traffic in 2018 to 2020
| Water basin | Year | ||
| 2018 | 2019 | 2020 | |
| Coasting and in inland waterways in total | 4,616,156 | 4,754,780 | 2,872,142 |
| Coasting in total | 4,382,248 | 4,523,960 | 2,685,494 |
| Gulf of Finland | 3,044,188 | 3,197,655 | 1,697,448 |
| Archipelago Sea | 261,406 | 231,820 | 219,668 |
| Traffic between the mainland and �land | 663,392 | 667,995 | 373,763 |
| �land | 395,325 | 395,983 | 371,303 |
| Sea of Bothnia | 3,953 | .. | 8,143 |
| Bay of Bothnia | 20,645 | 26,407 | 15,169 |
| Inland waterways in total | 233,908 | 230,820 | 186,648 |
| Vuoksi watercourse | 103,127 | 110,965 | 109,787 |
| Kymi River watercourse | 32,413 | 29,372 | 13,136 |
| Kokem�ki River watercourse | 70,303 | .. | .. |
| Ostrobothnias area | 2,305 | .. | .. |
| Oulu river and northern Finland | 25,760 | 15,369 | 13,850 |
1) .. = Data is subject to secrecy
Source: Transport and Tourism, Statistics Finland
Inquiries: Matti Kokkonen 029 551 3770, Olli Kajava 029 551 3531, matti.kokkonen@stat.fi
Head of Department in charge: Hannele Orjala
Publication in pdf-format (190.9 kB)
- Tables
-
Tables in databases
Pick the data you need into tables, view the data as graphs, or download the data for your use.
Updated 10.06.2021
Official Statistics of Finland (OSF):
Domestic Waterborne Traffic [e-publication].
ISSN=2670-1979. 2020. Helsinki: Statistics Finland [referred: 16.4.2024].
Access method: http://www.stat.fi/til/kvliik/2020/kvliik_2020_2021-06-10_tie_001_en.html