

Published: 7 October 2021
Share of culture in the economy decreased further in 2019
According to the latest calculations of the culture satellite, the share of culture in the economy has decreased slightly compared to the previous year, that is, the share in GDP was 3.1 per cent in 2019 (3.3 per cent in 2018). The calculations are compiled at such a long delay because they are done only when the calculations of the National Accounts have been compiled at the most detailed level. The now compiled calculations continue the earlier time series.
According to the culture satellite, both output and value added accounted for slightly over three per cent of GDP in 2019. Examined at current prices, both the output and value added of culture decreased slightly and while both output and GDP grew clearly on the level of the whole economy, the share of culture diminished. However, value added changed in different ways between cultural industries – growth was particularly seen in artistic, stage and concert activities, while the biggest drop was recorded in films, videos and computer games, and in amusement parks and other entertainment and recreation.
Percentage share of cultural industries in the national economy in 2008 to 2019
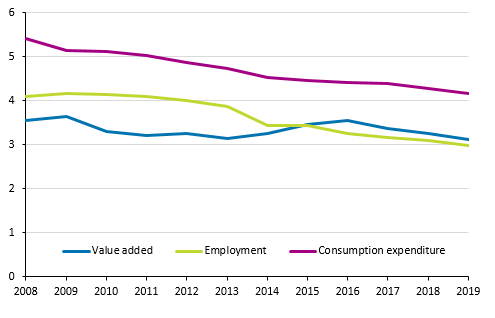
In 2019, the share of combined consumption expenditure of culture in all consumption expenditure fell further. General government’s consumption expenditure on culture rose slightly, while private consumption expenditure fell somewhat, and combined, consumption expenditure on culture remained on level with the previous year. As the combined consumption expenditure of the whole economy grew, the share of culture in consumption expenditure decreased, being now 4.2 per cent (4.3 per cent in 2018).
According to the culture satellite, the share of culture in employment was 3.0 per cent in 2019. The culture satellite takes into account employed persons from the industries included in the calculation regardless of their tasks, while employment is considered in the cultural statistics both by occupation and industry. The cultural statistics show growth in employment in 2019, while according to the satellite accounts, the number of employed persons in cultural industries would in practice have remained unchanged and the share of employed persons would have fallen relative to employed persons in the whole economy, as the number of employed persons in the whole economy has grown. An estimate of employment based on the wages and salaries sum may underestimate the number of employees if the work is part-time, low-paid or short-term, which is quite typical in the field of culture. The falling trend in the number of employed persons in cultural industries that has continued since 2008 still does not seem to have changed in the cultural satellite accounts.
Culture has conventionally been regarded as an activity that balances economic cycles, whose role usually grows somewhat during a downturn, because it includes several permanent elements. The share of non-profit and public activities is significant and maximising profits is not always the primary objective. Culture is produced for its own sake, even without profit. However, the downturn of the early 2010s was visible in both cultural production and its consumption; also when it comes to culture, people look for more inexpensive alternatives when the economy is tight, and the money spent on culture has not made much of an upturn even if the economy has grown. The pandemic that started in 2020 will probably be visible in cultural satellite accounts in future years, even though the method is somewhat crude and does not cover all details of the changes.
Although the share of culture in the economy has been falling on the long term, culture still has a fairly important role in the national economy, because its share of consumption is nevertheless good four per cent and its share of employed three per cent.
The statistics on Culture Satellite Accounts depict the economic significance of culture, using the concepts and methods of national accounts. Data according to the Standard Industrial Classification TOL 2008 have now been released for the years 2008 to 2019 in accordance with the ESA2010 system and the time series revisions published in autumn 2019. In autumn 2020, a classification revision to the ECOICOP classification for households’ consumption expenditure was adopted in the culture satellite accounts and in that connection the consumption classification used in the culture satellite was also modified. In connection with the classification revision a few items had not been updated in the database tables, and these updates have now been made in this round – some years had minor changes but they did not have an effect on the overall image. A small revision was also made in the calculations of output and value added for 2018 concerning films, videos and computer games, in which case the share of this industry group decreased slightly within culture, but the share of culture in the whole economy was not affected by this correction.
The data for the Culture Satellite Accounts are published on the statistics website as database tables.
Source: Culture Satellite Accounts, Statistics Finland
Inquiries: Katri Soinne 029 551 2778, kansantalous@stat.fi
Head of Department in charge: Katri Kaaja
Publication in pdf-format (217.1 kB)
- Tables
-
Tables in databases
Pick the data you need into tables, view the data as graphs, or download the data for your use.
Appendix tables
Updated 07.10.2021
Statistics:
Culture satellite accounts [e-publication].
ISSN=2323-9905. 2019. Helsinki: Statistics Finland [referred: 26.4.2024].
Access method: http://www.stat.fi/til/klts/2019/klts_2019_2021-10-07_tie_001_en.html